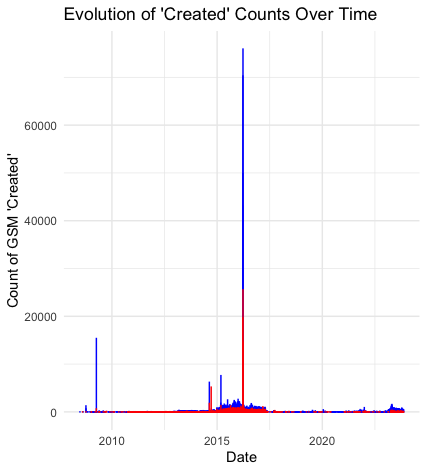
A friend and I are working on a project in which we’d need to know cell coverage in India. One thing we’re looking at preliminarily is how the created counts trend over time. When we plotted this, we noticed a huge spike on a single date in 2016 (see image).
Does anyone know what’s going on here? It’s hard to believe that so many towers would truly be first picked up on a single date.
The huge spike in created date does not mean all the cells were installed on that particular day in 2016. It is possible that is was a bulk data submission by a new data contributor.
Reviving this thread. That spike roughly corresponds to 2016 Q3 when Reliance Jio launched across India. You might want to check if the new towers on the date of the spike share similar MNCs.